← [Documentation index](../../README.md)
# Diffusers and Their Coefficients
A diffuser is judged by where it sends the sound it reflects, and two
standardised coefficients grade that job from two different angles. The
**scattering coefficient** $s$ (ISO 17497-1) is measured in a reverberation
room and does energy bookkeeping: what fraction of the reflected energy leaves
the specular direction. The **diffusion coefficient** $d$ (ISO 17497-2) is
measured on a free-field goniometer and grades spatial quality: how evenly the
reflected energy covers a polar arc of receivers. This guide covers both
measurements, the prediction of the diffusion coefficient from a Schroeder
diffuser design before a sample is built, the published tables to reach for
when no room is available, and the recurring confusion between the two
coefficients.
The two coefficients answer different questions and are not interchangeable:
scattering is *how much* energy leaves the specular direction; diffusion is
*how evenly* the reflected energy is spread over angle. The
[closing section](#scattering-or-diffusion-two-coefficients-two-jobs) makes
the distinction precise. The deep-subwavelength relatives of the Schroeder
designs treated here, panels a few centimetres thick that scatter like wells
tens of centimetres deep, have their own guide:
[Metadiffusers](metadiffusers.md).
## 1. Random-incidence scattering coefficient (ISO 17497-1)
The scattering coefficient $s$ is the fraction of reflected energy that does
**not** leave the surface in the specular direction. ISO 17497-1 measures it in a
reverberation room from four reverberation-time situations: with the test sample
mounted on a turntable and held **stationary**, and with the turntable
**rotating** (which averages the phase-coherent specular reflection away), each
with and without a reflecting base plate.
**Absorption from reverberation time (Clause 6).** Each situation converts to a
Sabine absorption coefficient with the standard's own air-attenuation term:
$$
\alpha = 55.3\,\frac{V}{S}\left(\frac{1}{c_2 T_2} - \frac{1}{c_1 T_1}\right)
- 4\,\frac{V}{S}\,(m_2 - m_1),
$$
where $V$ is the room volume, $S$ the sample area, $T$ the reverberation time,
$c$ the speed of sound (Eq. (2): $c = 343.2\sqrt{(273.15+t)/293.15}$) and $m$ the
power attenuation coefficient of air. The **stationary** pair gives the
random-incidence absorption $\alpha_\mathrm{s}$ (Eq. (1)); the **rotating** pair gives the
specular absorption $\alpha_\mathrm{spec}$ (Eq. (4)).
**Scattering coefficient (Eq. (5)).** The two combine into
$$
s = \frac{\alpha_\mathrm{spec} - \alpha_\mathrm{s}}{1 - \alpha_\mathrm{s}}.
$$
A fully specular surface reflects all its non-absorbed energy in the specular
direction, so $\alpha_\mathrm{spec} = \alpha_\mathrm{s}$ and $s = 0$; a strong diffuser sends
energy everywhere, raising $\alpha_\mathrm{spec}$ towards 1 and $s$ towards 1.
```python
from phonometry import materials
# Four reverberation-time situations reduced to two absorption coefficients.
# alpha_s from the stationary pair (Eq. 1); alpha_spec from the rotating pair
# (Eq. 4). V = 200 m^3, S = 10 m^2, c = 343.2 m/s throughout.
alpha_s = materials.random_incidence_absorption(200.0, 10.0, c1=343.2, t1=8.0,
c2=343.2, t2=6.0)
alpha_spec = materials.specular_absorption_coefficient(200.0, 10.0, c3=343.2, t3=7.5,
c4=343.2, t4=5.0)
s = materials.scattering_coefficient(alpha_spec, alpha_s) # Eq. (5)
print(round(float(alpha_s), 4)) # 0.1343
print(round(float(alpha_spec), 4)) # 0.2148
print(round(float(s), 4)) # 0.0931
```
Over a full one-third-octave measurement, `scattering_coefficient_spectrum`
pairs the per-band $\alpha_\mathrm{spec}$ and $\alpha_\mathrm{s}$ with their band centres and
returns a plottable `ScatteringResult`:
```python
import numpy as np
from phonometry import materials
# A 13-band measurement (250-4000 Hz): the random-incidence absorption alpha_s
# (stationary sample) and the specular absorption alpha_spec (rotating
# turntable). A diffuser scatters more with frequency, so s(f) rises.
freqs = np.array([250, 315, 400, 500, 630, 800, 1000,
1250, 1600, 2000, 2500, 3150, 4000], float)
alpha_s = np.full_like(freqs, 0.10)
alpha_spec = 0.11 + 0.75 * (np.log10(freqs / 250) / np.log10(4000 / 250))
result = materials.scattering_coefficient_spectrum(alpha_spec, alpha_s, frequencies=freqs)
print(np.round(result.scattering[[0, 6, 12]], 3)) # [0.011 0.428 0.844]
result.plot() # s(f) on a log-frequency axis, 0 to 1 (needs matplotlib)
```
*The scattering coefficient climbs with frequency: at low frequency the surface
relief is small compared with the wavelength and the reflection stays specular
($s \to 0$); as the wavelength shrinks the relief scatters more energy out of
the specular direction ($s \to 1$).*
Show the code for this figure
```python
import matplotlib.pyplot as plt
import numpy as np
from phonometry import materials
# A 13-band measurement (250-4000 Hz): the random-incidence absorption alpha_s
# (stationary sample) and the specular absorption alpha_spec (rotating
# turntable). A diffuser scatters more with frequency, so s(f) rises.
freqs = np.array([250, 315, 400, 500, 630, 800, 1000,
1250, 1600, 2000, 2500, 3150, 4000], float)
alpha_s = np.full_like(freqs, 0.10)
alpha_spec = 0.11 + 0.75 * (np.log10(freqs / 250) / np.log10(4000 / 250))
result = materials.scattering_coefficient_spectrum(alpha_spec, alpha_s, frequencies=freqs)
# result is the ScatteringResult computed above. One line:
result.plot()
plt.show()
# By hand, from the result's fields, mirroring what ScatteringResult.plot() draws:
fig, ax = plt.subplots()
ax.semilogx(result.frequencies, result.scattering, "o-", color="#1f77b4")
ax.set_xlabel("Frequency [Hz]")
ax.set_ylabel("Scattering coefficient s")
ax.set_ylim(0.0, 1.0)
ax.set_title("Random-incidence scattering coefficient (ISO 17497-1)")
plt.show()
```
**Base-plate check (Clause 6.2, Table 1).** The empty base plate must itself
scatter only negligibly, or it would bias the result. ISO 17497-1 caps the
base-plate scattering coefficient per one-third-octave band; the library exposes
those limits and a checker.
```python
from phonometry import materials
# The normative per-band ceilings (Table 1): 0.05 up to 500 Hz, rising to 0.25.
# materials.BASE_PLATE_BANDS_HZ is the band tuple; materials.BASE_PLATE_MAX_SCATTERING maps band -> ceiling.
print(materials.BASE_PLATE_BANDS_HZ[0], materials.BASE_PLATE_MAX_SCATTERING[100]) # 100 0.05
# A base plate whose measured scattering stays under the ceiling passes silently;
# an over-limit band raises a ScatteringDiffusionWarning listing the offenders.
check = materials.check_base_plate_scattering([0.02] * len(materials.BASE_PLATE_BANDS_HZ))
print(check.passes, check.exceeded_frequencies.size) # True 0
```
The check holds the eighteen measured coefficients against the eighteen limits,
band by band: `margins` is what each band has left, `exceeds` marks the bands
over their limit and `exceeded_frequencies` names them, and `.plot()` draws the
coefficients against the stepped limit with the bands over it ringed. A band at
its limit is within it, because Table 1 is a ceiling that "shall not be
exceeded". The bands are the full-scale frequencies $f/N$ that Table 1 is keyed
to, and so is the axis of the figure: on a 1:N scale model each band is
measured at N times the frequency shown.
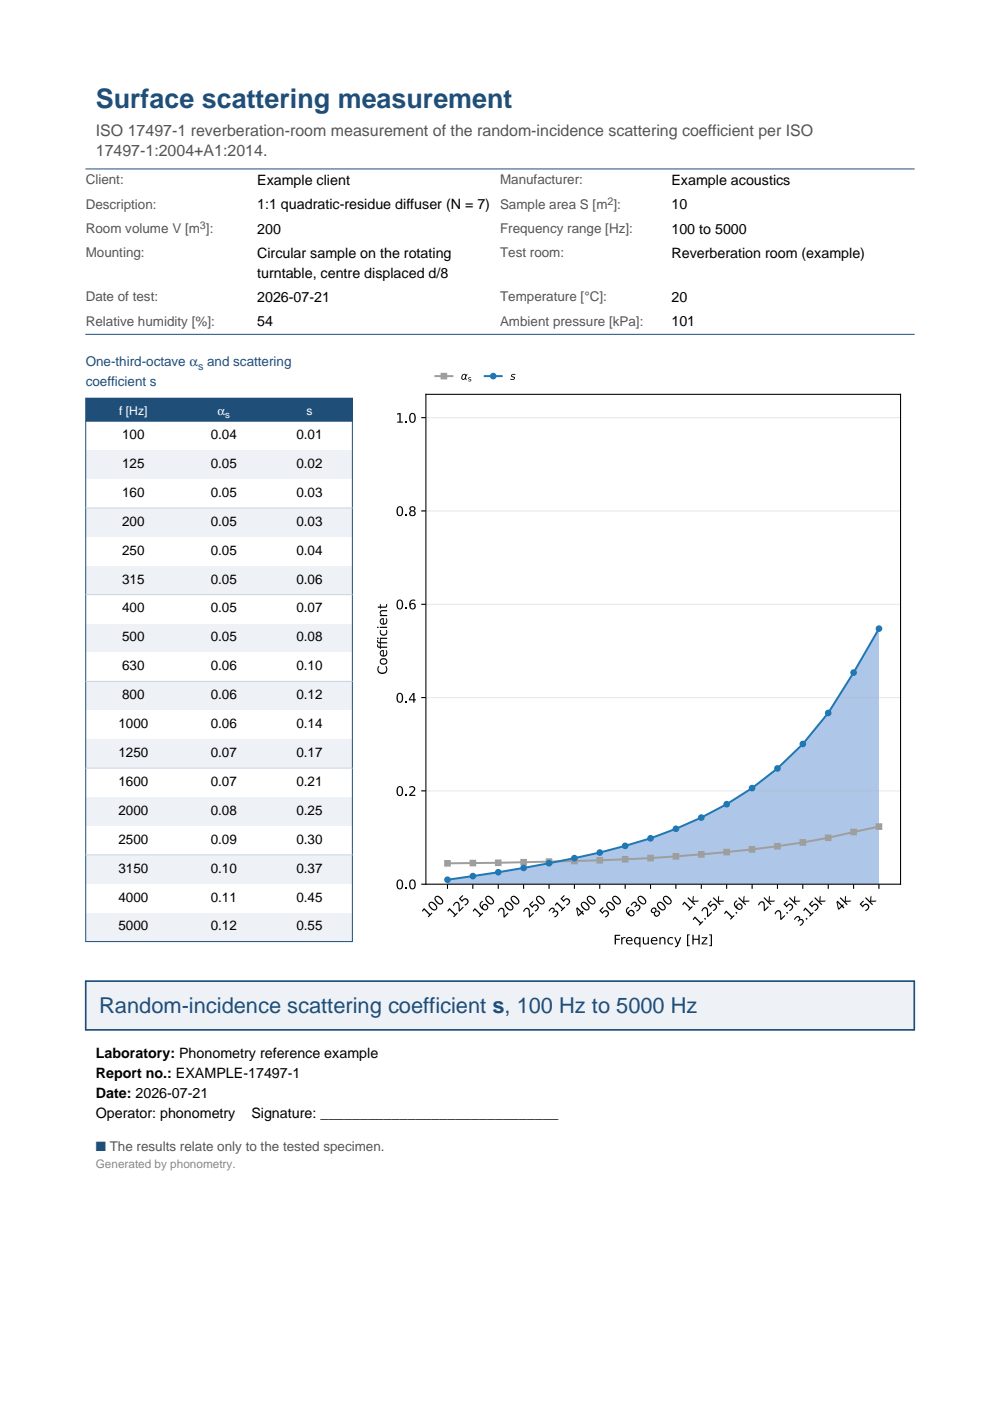
**Test-report fiche.** `ScatteringResult.report(path)` renders a one-page
accredited scattering test report (ISO 17497-1): a metadata header, the
per-one-third-octave table of the random-incidence absorption $\alpha_\mathrm{s}$ and the
scattering coefficient $s$ beside the $s(f)$ curve on a categorical band axis,
and a boxed characterisation headline (no pass/fail). `verbose=True` adds the
specular absorption $\alpha_\mathrm{spec}$ column and `language="es"` renders the
Spanish fiche; it needs the report extra (`pip install "phonometry[report]"`).
[](https://raw.githubusercontent.com/jmrplens/phonometry/main/.github/reports/iso17497_scattering_example.pdf)
## 2. Diffusion coefficient (ISO 17497-2)
The diffusion coefficient $d$ measures the **spatial uniformity** of the
reflected sound, not how much is scattered. A goniometer sweeps a receiver over a
polar arc and records the reflected level $L_i$ at each angle; the coefficient is
the normalised autocorrelation of the polar energy distribution.
*A note on symbols before the formulas.* ISO 17497-2 writes the normalised
coefficient $d_\mathrm{n}$, its n upright because it stands for "normalized",
and this page writes it the same way; section 3 writes $d_n$, its n italic,
for the **depth** of well $n$, so the slope of the subscript is what tells
the two apart. In the same spirit, the $s_n$ of section 3 is a quadratic-residue
depth index, not the scattering coefficient $s$ of section 1; the area factor
$N_i$ below is unrelated to the sequence order $N$ of section 3; and the $n$
of Formula (5) counts receivers, not wells.
**Autocorrelation (Formula (5)).** For $n$ receivers at equal angular spacing,
with $p_i = 10^{L_i/10}$ the band energy at receiver $i$,
$$
d = \frac{\left(\sum_i p_i\right)^2 - \sum_i p_i^2}
{(n-1)\,\sum_i p_i^2}.
$$
A perfectly uniform polar response ($L_i$ all equal) gives $d = 1$; a single
sharp specular lobe gives $d = 0$. When receivers subtend unequal solid angles,
Formula (6) area-weights each energy by $N_i$ from Formula (8), and those area
factors are evaluated in **radians**, which is why a 5° spacing at the zenith
produces a weight near 1.57, not 51.9.
The rig those formulas assume is worth drawing to scale.
`plot_goniometer_geometry` lays out the standard arrangement in plan: the
37-microphone semicircle every 5 degrees at 5 m around the sample, the source
at 10 m on the normal.
*The polar arc behind every $L_i$ of Formula (5), to scale: 37 receivers every
5 degrees at 5 m, the source twice as far out on the normal, and the sample a
sliver at the centre.*
Show the code for this figure
```python
import matplotlib.pyplot as plt
from phonometry import materials
# The standard arrangement: 37 microphones every 5 degrees at 5 m, the
# source at 10 m on the normal.
materials.plot_goniometer_geometry()
plt.show()
```
The animation below runs that goniometer experiment numerically: the same
plane wavefront hits a flat rigid panel and a Schroeder diffuser (an $N = 7$
quadratic-residue profile), and the scattered energy on the receiver arc turns
a collimated specular beam ($d = 0.32$) into a wide fan ($d = 0.63$).
[Watch the high-resolution video (WebM)](https://raw.githubusercontent.com/jmrplens/phonometry-assets/main/images/anim_fdtd_diffusion.webm)
The single-plane response below is the far-field prediction of a published
diffuser geometry: an $N = 7$ quadratic-residue diffuser of 6 periods, 3.6 m
total width and 0.2 m maximum well depth (the "N = 7 QRD, 6 periods, 0.2 m
deep" row of Cox & D'Antonio, *Acoustic Absorbers and Diffusers*, 3rd ed.,
Appendix B; the commercial $N = 7$ QRD measured by Hargreaves, Cox, Lam &
D'Antonio, *J. Acoust. Soc. Am.* 108(4), 1710-1720, 2000, Table I) and its
equal-footprint flat reference panel, at 1000 Hz, normal incidence, on the
standard 37-point semicircle (5° spacing, $-90°$ to $+90°$). The same model
levels drive the phonometry conformance suite as an arithmetic oracle for
Formulas (5) and (7); the external third-party anchor checks the model's
band-averaged normalised diffusion against the published Appendix B BEM table
in the 200-400 Hz bands (agreement within 0.01; over the full published
100-5000 Hz range the model-vs-BEM mean absolute deviation is about 0.09,
because edge diffraction is outside the Fraunhofer model).
The surface itself is worth drawing before predicting anything from it.
`plot_qrd_geometry` turns the depth sequence into the to-scale well profile
below, and a predicted `DiffuserPolarResponse` retains its geometry, so
`qrd.plot_geometry()` draws the surface it was computed for.
*Two of the six periods, to scale: the quadratic residues $n^2 \bmod 7$
turned into a buildable surface. The 490 Hz design frequency is what puts
the deepest well at exactly 200 mm.*
Show the code for this figure
```python
import matplotlib.pyplot as plt
from phonometry import materials
# The published N = 7 QRD: well width 3.6 m / 42, deepest well 0.2 m.
depths = materials.qrd_well_depths(7, 490.0, speed_of_sound=343.0)
pitch = 3.6 / 42 # 42 wells across the 3.6 m panel
fin = 0.005 # thin fins, included in the pitch
materials.plot_qrd_geometry(depths, pitch - fin, fin_width=fin, n_repetitions=2)
plt.show()
# A predicted DiffuserPolarResponse retains its geometry, so
# qrd.plot_geometry() draws the profile it was computed for (all 6 repetitions).
```
```python
from phonometry import materials
# The published geometry: N = 7 QRD, 6 repetitions, 3.6 m wide, 0.2 m deep
# (Cox & D'Antonio 3rd ed., Appendix B; Hargreaves et al. 2000, Table I).
# Design frequency 490 Hz puts the deepest well at exactly 0.2 m.
depths = materials.qrd_well_depths(7, 490.0) # [0, 0.05, 0.2, 0.1, ...] m
qrd = materials.predict_diffuser_polar_response(
3.6 / 42, 1000.0, depths=depths, n_repetitions=6)
# The flat reference panel: the same 3.6 m footprint with zero-depth wells.
flat = materials.predict_diffuser_polar_response(
3.6 / 42, 1000.0, depths=[0.0] * 7, n_repetitions=6)
qrd.plot() # predicted polar response, d in the title (needs matplotlib)
d = materials.directional_diffusion_coefficient(qrd.levels) # Formula (5)
print(round(float(d), 4)) # 0.1099
d_ref = materials.directional_diffusion_coefficient(flat.levels)
print(round(float(d_ref), 4)) # 0.0049
# Normalise against the flat reference to isolate the diffuser's own effect
# (Formula (7)): d_n = (d - d_ref) / (1 - d_ref).
d_n = materials.normalized_diffusion_coefficient(d, d_ref)
print(round(float(d_n), 4)) # 0.1055
# Random-incidence value: average the band coefficients over source positions,
# with the standard's 2-D weighting (0 deg -> 1, +/-30/+/-60 deg -> 3).
d_random = materials.random_incidence_diffusion(
[0.5, 0.2, 0.2, 0.2, 0.2], weights=materials.TWO_DIMENSIONAL_SOURCE_WEIGHTS)
print(round(float(d_random), 4)) # 0.2231
```
`directional_diffusion` keeps the receiver angles beside the levels of a full
goniometer sweep and returns a plottable `DiffusionResult`. Reusing the QRD
polar levels from above:
```python
import numpy as np
from phonometry import materials
# qrd.levels: the 37 predicted QRD levels from the example above.
angles_deg = np.arange(-90.0, 90.5, 5.0)
result = materials.directional_diffusion(angles_deg, qrd.levels)
print(round(result.coefficient, 2)) # 0.11
result.plot() # polar reflected response, d in the title (needs matplotlib)
```
*The periodic QRD array splits the reflected energy into a fan of discrete
grating lobes rather than one specular spike, but six repetitions of the same
period concentrate the energy in those few directions, so the autocorrelation
diffusion coefficient stays modest ($d \approx 0.11$). The flat reference
panel collapses into the specular direction alone and drops to
$d \approx 0.005$; this lobing penalty of periodic arrays is exactly why
Cox & D'Antonio recommend modulated arrangements.*
Show the code for this figure
```python
import matplotlib.pyplot as plt
import numpy as np
from phonometry import materials
# qrd.levels: the 37 predicted levels L_i of the six-period_m N = 7 QRD from
# the example above (Fraunhofer far-field model, published Cox & D'Antonio
# Appendix B geometry, 1000 Hz, normal incidence) on the -90..90 deg, 5 deg
# semicircle. The periodic array concentrates the energy into grating lobes,
# so the Formula (5) coefficient d is modest.
angles_deg = np.arange(-90.0, 90.5, 5.0)
result = materials.directional_diffusion(angles_deg, qrd.levels)
# result is the DiffusionResult computed above. One line:
result.plot()
plt.show()
# By hand: a polar plot of the levels, with d annotated in the title.
fig, ax = plt.subplots(subplot_kw={"projection": "polar"})
theta = np.radians(result.angles_deg)
ax.plot(theta, result.levels, "o-", color="#1f77b4")
ax.fill(theta, result.levels, color="#1f77b4", alpha=0.15)
ax.set_theta_zero_location("N")
ax.set_theta_direction(-1)
ax.set_thetamin(-90)
ax.set_thetamax(90)
ax.set_title(f"Directional diffusion d = {result.coefficient:.2f} (ISO 17497-2)")
plt.show()
```
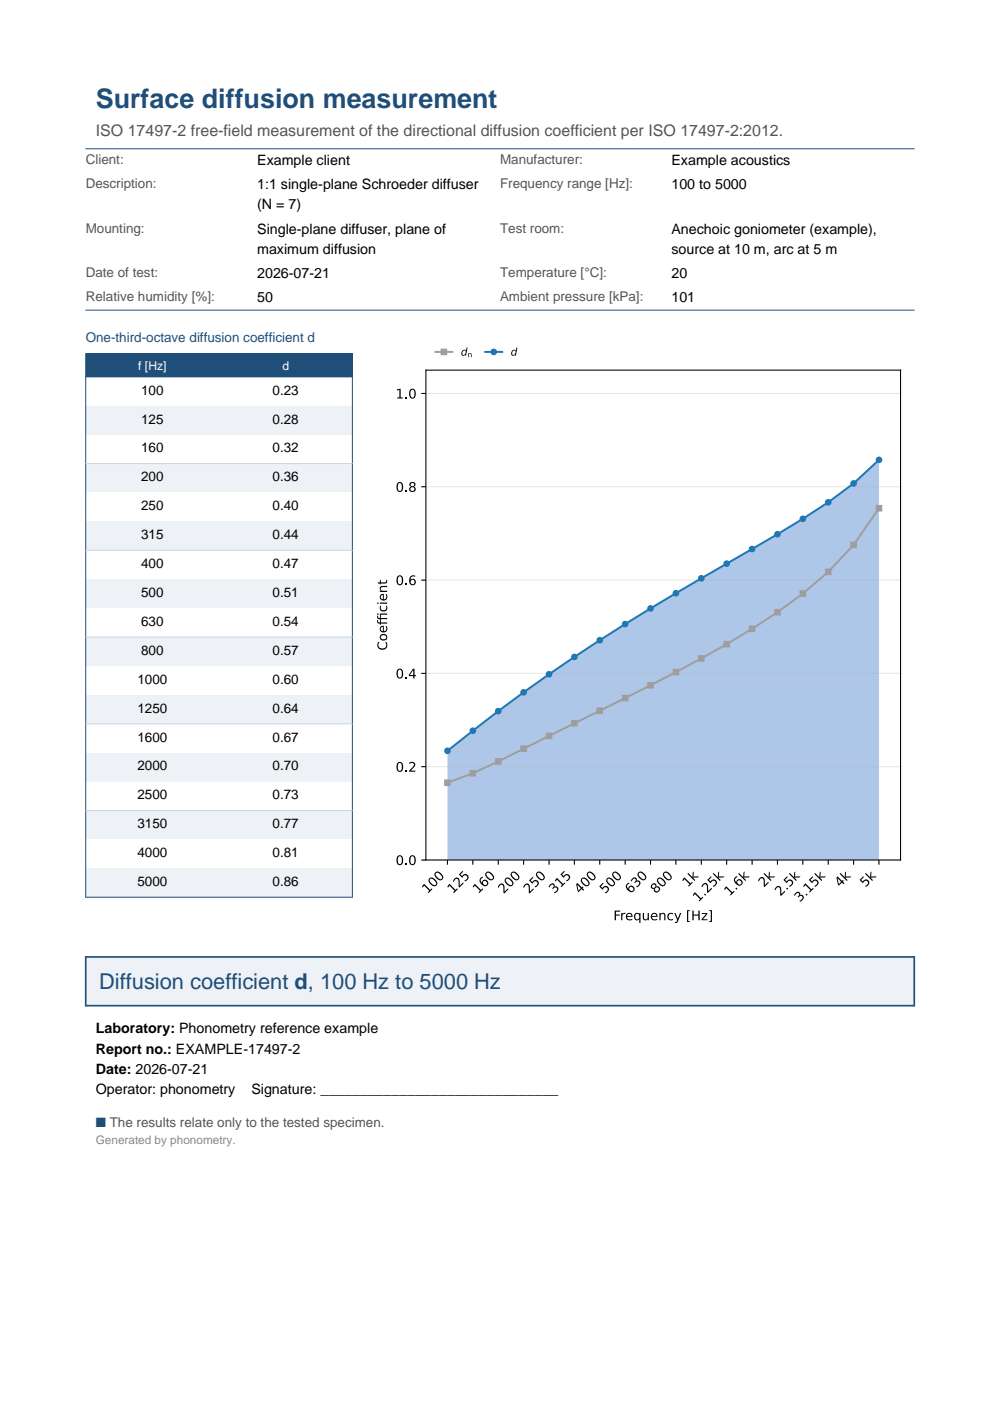
**Test-report fiche.** Collected across the one-third-octave bands, the
diffusion coefficient $d(f)$ forms a `DiffusionSpectrum`
(`materials.diffusion_spectrum(d, frequencies=freqs, ...)`), whose `report(path)` renders a
one-page diffusion test report (ISO 17497-2, Clause 8.5): the per-band table of
$d$ beside the $d(f)$ band-axis curve, with a boxed characterisation headline.
Per Clause 8.4 the random-incidence coefficient is itself a per-band quantity,
the average of the directional coefficients over the source positions band by
band (not a mean across frequency). `verbose=True` adds the normalised $d_\mathrm{n}$
column to the table (the curve always draws $d_\mathrm{n}$ as a companion when present).
```python
import numpy as np
from phonometry import materials
# One diffusion coefficient per band (here a closed-form example). In practice
# each band's random-incidence d is the source-position average of the
# directional coefficients: for band k, average directional_diffusion_coefficient
# over the source positions with random_incidence_diffusion (Clause 8.4).
freqs = np.array([250, 500, 1000, 2000, 4000], float)
d = np.array([0.30, 0.45, 0.60, 0.75, 0.88])
spectrum = materials.diffusion_spectrum(d, frequencies=freqs)
spectrum.plot() # d(f) on the band axis (needs matplotlib)
spectrum.report("diffusion.pdf") # one-page fiche (needs phonometry[report])
```
[](https://raw.githubusercontent.com/jmrplens/phonometry/main/.github/reports/iso17497_diffusion_example.pdf)
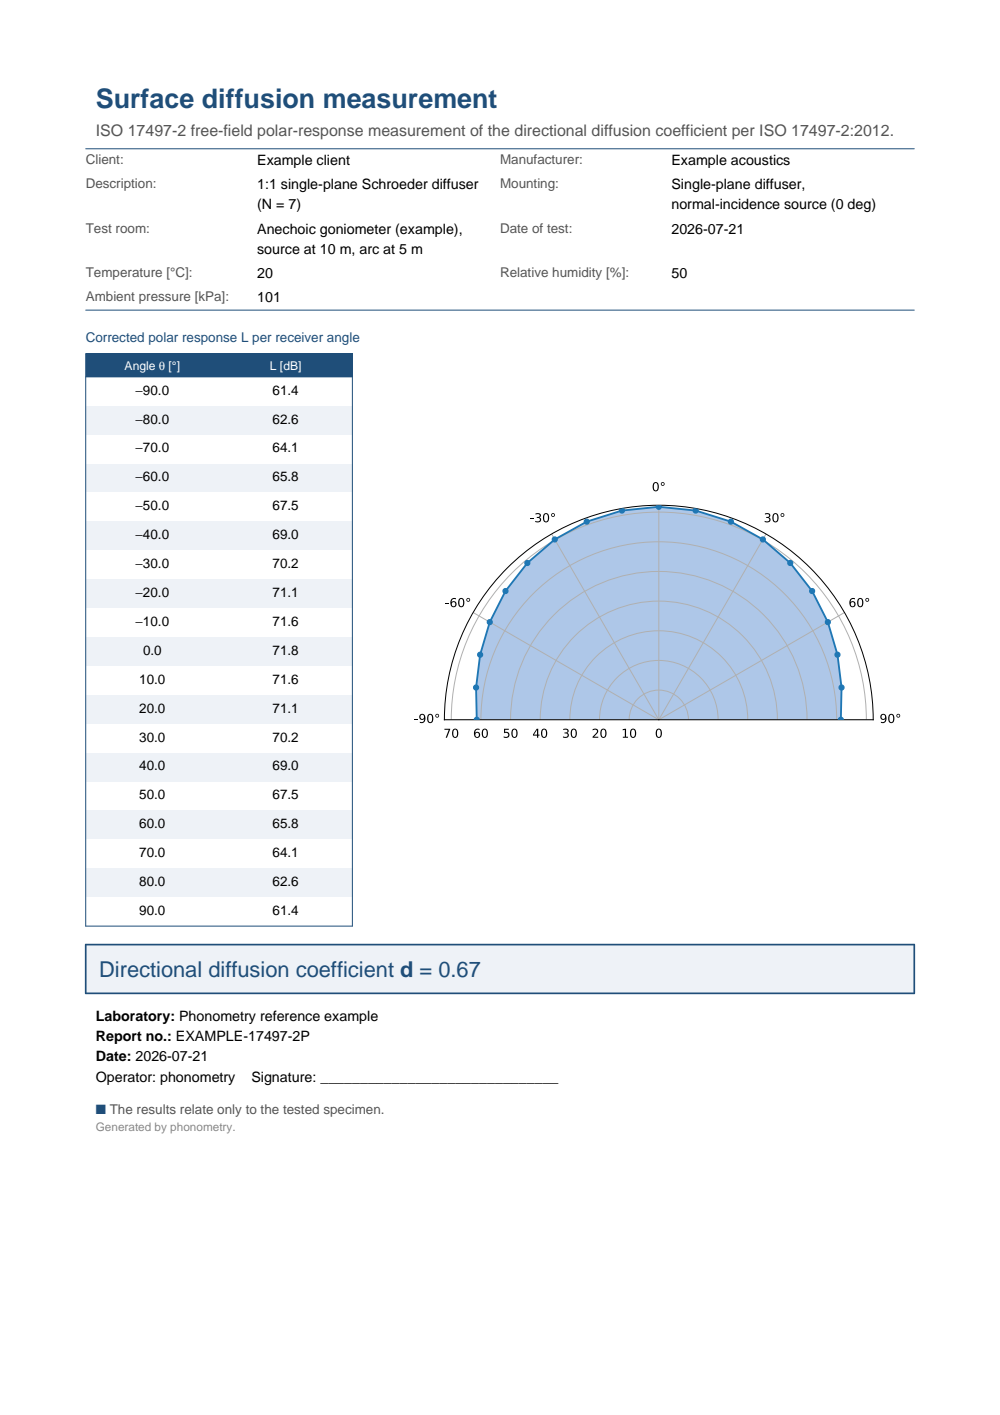
A single band's polar response is itself reportable:
`DiffusionResult.report(path)` renders the corrected receiver-angle /
reflected-level table beside the semicircular polar plot, boxing that band's
directional diffusion coefficient.
[](https://raw.githubusercontent.com/jmrplens/phonometry/main/.github/reports/iso17497_diffusion_polar_example.pdf)
*Single-source polar-response fiche (`DiffusionResult.report`), the reflected
level over the receiver arc. The spectrum fiche above grades a surface across
frequency; this one is the raw evidence behind a single band of it, and it is
what a goniometer session actually produces.*
## 3. Designing a Schroeder diffuser
The measurements above grade a surface that already exists. The classic way to
*design* one is Schroeder's phase grating: divide the surface into wells of
equal width and different depths, so that each well returns the incident wave
with a different phase. A rigid-bottomed well of depth $d_n$ reflects with the
pressure coefficient
$$
R_n = \mathrm{e}^{-2 j k d_n},
$$
the round trip down and back up the well, so the depth sequence is a phase
sequence in disguise. Schroeder's insight is number-theoretic: if the depths
follow a **quadratic residue sequence**,
$$
s_n = n^2 \bmod N, \qquad
d_n = \frac{s_n\,\lambda_0}{2N}, \qquad \lambda_0 = \frac{c}{f_0},
$$
for a prime $N$ and a chosen **design frequency** $f_0$ (Cox & D'Antonio
Eqs. (10.2)/(10.3)), then at $f_0$ the reflection phases $-4\pi s_n / (2N)$
sample a sequence whose discrete Fourier transform has constant magnitude, and
the energy radiated into the grating lobes of the periodic surface is the same
in every lobe. The surface spreads the reflection as evenly as a periodic
surface can.
A handful of design rules follow directly from the geometry:
- **The design frequency sets the depth.** The deepest well is
$d_\mathrm{max} = \max(s_n)\,\lambda_0/(2N)$, close to half a wavelength for large
$N$; halve $f_0$ and the diffuser gets twice as deep. This is the cost that
the [metadiffuser](metadiffusers.md) attacks: at 500 Hz an $N = 5$ design
already calls for wells 27.4 cm deep.
- **The sequence repeats what the prime provides.** $s_n$ is symmetric about
$n = 0$ and periodic in $N$, so one period has $N$ wells and the profile is
built by repeating it. The flat-phase property also holds at the harmonics
$2f_0, 3f_0, \ldots$, except at multiples of $N f_0$, where every well
reflects in phase again and the panel momentarily behaves like a flat plate.
- **The well width sets the ceiling.** Each well is a small waveguide; the
single-plane-wave picture inside it holds only while the width $w$ stays
below half a wavelength, giving an upper working limit near
$f_\mathrm{max} = c/(2w)$. Narrower wells raise the ceiling but add viscous losses
and fins.
- **Periodicity concentrates, modulation spreads.** Repeating one period
locks the reflected energy into grating lobes at
$\sin\theta_m = \sin\psi + m\lambda/L$ for period length $L$: even a
perfect phase sequence then feeds a finite set of directions, which is the
lobing penalty measured on the polar response above. Modulating two
different sequences (or a sequence and its inverse) breaks the periodicity
and recovers diffusion; primitive-root sequences ($s_n = r^n \bmod N$)
additionally suppress the specular lobe at the design frequency.
`qrd_well_depths` evaluates the depth sequence and
`predict_diffuser_polar_response` grades the design before anything is built,
which is the subject of the next section. Only the quadratic-residue sequence
has a dedicated helper: a primitive-root, modulated or otherwise custom
profile enters through the explicit `depths` or `reflection` arguments.
### Predicting diffusion from a diffuser design
The autocorrelation coefficient above reduces a *measured* polar response. The
same coefficient can be *predicted* from the physical design of a Schroeder
phase-grating diffuser, so a well-depth sequence can be graded before a sample
is built. `predict_diffuser_polar_response` evaluates the single-plane
Fraunhofer (far-field) model of Cox and D'Antonio: each rigid-bottom well of
depth $d_n$ contributes a pressure reflection coefficient
$R_n = \mathrm{e}^{-2 j k d_n}$, and the scattered pressure at reflection angle $\theta$
for a source at incidence $\psi$ is the sum over the wells of the periodic
surface (Eq. (5.8)),
$$
p(\theta) = F(\theta) \sum_n R_n \, \mathrm{e}^{\,j k x_n (\sin\psi + \sin\theta)},
$$
with $x_n$ the well centre and $k = 2\pi f / c$. The predicted polar levels
$L_i = 20\log_{10}|p(\theta_i)|$ feed the same `directional_diffusion_coefficient` as
a measurement.
```python
import numpy as np
from phonometry import materials
# An N = 7 quadratic residue diffuser, design frequency 500 Hz.
depths = materials.qrd_well_depths(7, 500.0) # Eqs. (10.2)/(10.3)
print(np.round(depths * 100, 1)) # well depths in cm:
# [ 0. 4.9 19.6 9.8 9.8 19.6 4.9]
# Predicted far-field polar response at one frequency (5 repeated repetitions,
# 10 cm wells), reduced to the ISO 17497-2 directional diffusion coefficient.
surface = materials.predict_diffuser_polar_response(0.10, 2000.0, depths=depths,
n_repetitions=5)
print(round(surface.coefficient, 3)) # 0.210
surface.plot() # predicted polar response, d in the title (needs matplotlib)
# The spectrum variant normalises band by band against the same-footprint flat
# reference (Formula (7)): the flat panel maps to exactly zero, the QRD well
# above it.
freqs = np.array([500, 1000, 2000, 4000], float)
qrd = materials.predicted_diffusion_spectrum(0.10, freqs, depths=depths, n_repetitions=5)
print(np.round(qrd.normalized, 3)) # [0.352 0.275 0.208 0.073]
flat = materials.predicted_diffusion_spectrum(0.10, freqs,
depths=np.zeros_like(depths), n_repetitions=5)
print(np.round(flat.normalized, 3)) # [0. 0. 0. 0.]
```
*Predicted from the design alone: the $N = 7$ QRD spreads the reflected energy
far more evenly than the flat panel of the same footprint, so its predicted
diffusion coefficient sits well above the near-specular flat reference across
the band. This is a far-field design estimate, not a substitute for an
ISO 17497-2 measurement; like every Fourier diffuser model it loses accuracy at
low frequency, at grazing angles and for strongly absorbing surfaces. An
arbitrary complex per-well reflection sequence can be supplied through the
`reflection` argument, so an admittance or resonator-loaded surface computed
elsewhere can be graded the same way.*
Show the code for this figure
```python
import matplotlib.pyplot as plt
import numpy as np
from phonometry import materials
# N = 7 QRD (design frequency 500 Hz, 10 cm wells, five repetitions) versus the
# flat panel of the same footprint, over the one-third-octave bands.
freqs = np.array([250, 315, 400, 500, 630, 800, 1000, 1250, 1600,
2000, 2500, 3150, 4000, 5000], float)
depths = materials.qrd_well_depths(7, 500.0)
qrd = materials.predicted_diffusion_spectrum(0.10, freqs, depths=depths, n_repetitions=5)
# The DiffusionSpectrum plots the predicted d(f) directly. One line:
qrd.plot()
plt.show()
# By hand: predicted d(f) for the QRD against the flat reference.
flat = materials.predicted_diffusion_spectrum(0.10, freqs,
depths=np.zeros_like(depths), n_repetitions=5,
normalize=False)
fig, ax = plt.subplots()
ax.semilogx(freqs, qrd.diffusion, "o-", color="#1f77b4", label="N = 7 QRD design")
ax.semilogx(freqs, flat.diffusion, "s--", color="#d62728", label="Flat panel")
ax.set_ylim(0.0, 1.0)
ax.set_xlabel("Frequency [Hz]")
ax.set_ylabel("Predicted diffusion coefficient d")
ax.legend()
plt.show()
```
## 4. Published values, when the room is not yours
Sections 1 and 2 assume you can measure, and section 3 assumes the surface is a
Schroeder diffuser you are designing yourself. Neither holds in the usual case:
the reverberation room with a turntable in it belongs to somebody else, the
goniometer arc even more so, and the number is needed this afternoon for a
surface that already exists and is not a Schroeder diffuser. Cox & D'Antonio
print three appendices of diffuser values for exactly that, B, C and D, and
this library holds them row by row, with the page each one was read from.
The upper panel is the argument the first section of Appendix B exists to
make, and no formula in the book makes it: one semicylinder scores 0.77 at
1 kHz at random incidence, and twelve of the same semicylinder score 0.22. A
lone object scatters into every direction because it has nothing to interfere
with; a periodic array of it concentrates the energy into grating lobes, and
the diffusion coefficient falls accordingly. Reading a single device's polar
response and scaling it up gets this wrong by a factor of three. The lower
panel is the other axis of the same appendix: six semiellipses of one width,
deepened from 1 cm to 30 cm, where the shallowest is acoustically flat as far
as 5 kHz is concerned and the deepest is diffusing over most of the range.
### What a published value is worth
One geometry, three published numbers, and nothing chosen to make a point:
Appendix D prints battens 10 cm high and 10 cm wide on a 20 cm period twice,
measured to ISO 17497-1 by two different teams, and Table C.2 computes the
same geometry with a boundary element model. Between 400 Hz and 1 kHz the two
*measurements* differ from each other by up to 0.2, which is the width of the
method and not anybody's mistake, and the computed curve runs below both.
Above 2 kHz all three converge.
That is what a row from these tables is: a value of the right order with a
spread of its own, useful to start a simulation, to sanity-check a
measurement, or to choose between two surface families. It is not a
specification, and a project that turns on the difference between 0.25 and
0.45 at 1 kHz needs its own measurement.
### Measured and computed are two catalogues
The library keeps them apart, with a class each and no key in common, because
a coefficient a solver produced and one a reverberation room produced are the
same number and not the same evidence:
```python
from phonometry import materials
# Measured under ISO 17497-1: forty-six surfaces, each credited to its paper.
battens = materials.scattering_named("Periodic 1D battens")
for row in battens:
print(row.name, row.spectrum()[1000], row.attributed_to["row"][:24])
# Computed: a hundred and nineteen rows, each naming its solver.
predicted = materials.PUBLISHED_PREDICTED_SCATTERING[
"cox-2017-table-c2/rectangular_cross_section_batt_h_10_cm_l_20_cm_w_10_cm"
]
print(predicted.model)
print(predicted.scattering_coefficient(1000))
```
`PUBLISHED_DIFFUSION` holds the diffusion coefficients of Appendix B the same
way, three rows per surface because the page prints one line per angle of
incidence. Its random incidence row carries no angle at all: it is an
arithmetic mean over ten angles, without the weighting a measurement to
ISO 17497-2 would apply, and asking it for the angle says so rather than
answering zero, which is what the normal incidence row of the same surface
means.
Every row refuses rather than inventing. A band the page left empty is not a
zero, and for a scattering coefficient a zero is a surface that sends every
ray back along the specular direction:
```python
row = materials.PUBLISHED_SCATTERING[
"cox-2017-appendix-d/periodic_1d_battens_h_w_10_cm_l_2h_sakuma"
]
print(row.why_missing("scattering_coefficient_5000"))
```
All three tables are published whole, filterable and with the source of
every row, each in its own catalogue: the
[scattering coefficients](https://docs.jmrp.io/phonometry/reference/catalogues/scattering-coefficients/), the
[diffusion coefficients](https://docs.jmrp.io/phonometry/reference/catalogues/diffusion-coefficients/) and the
[predicted scattering coefficients](https://docs.jmrp.io/phonometry/reference/catalogues/predicted-scattering-coefficients/).
## Scattering or diffusion? Two coefficients, two jobs
The two coefficients above are routinely treated as interchangeable, in
product data sheets and occasionally in simulation manuals. They are not, and
neither can be computed from the other. The scattering coefficient $s$
(ISO 17497-1) does **energy bookkeeping**: what fraction of the reflected
energy leaves the specular direction. It says nothing about where that energy
goes. The diffusion coefficient $d$ (ISO 17497-2) grades **spatial quality**:
how evenly the reflected energy covers the receiver arc, one source direction
at a time. It says nothing about how the energy divides between the specular
lobe and the rest.
A pair of counterexamples keeps them apart. A curved or tilted element that
*redirects* the reflection concentrates nearly all the reflected energy into
one strong lobe away from the specular direction: almost everything is
non-specular, so $s$ is high, yet the beam is as collimated as a mirror's, so
$d$ stays low. Conversely, a small flat panel measured at low frequency sends
nearly all the reflected energy toward the specular direction, so $s$ stays
near zero, yet edge diffraction spreads that reflection so broadly over the
receiver arc that the measured $d$ comes out surprisingly high. High $s$ does
not mean uniform; decent $d$ does not mean much energy was scattered at all.
**Which one for design.** The two numbers serve different consumers:
- **The scattering coefficient feeds room-acoustics simulation.**
Geometrical-acoustics engines decide at every wall reflection how much
energy continues specularly and how much is redistributed; the per-band
random-incidence $s$ of each surface is precisely that split, which is what
ISO 17497-1 was written to supply. Getting it wrong shows up as the wrong
reverberation-time and clarity predictions in non-mixing rooms.
- **The diffusion coefficient qualifies diffusers.** When the task is to break
up an echo, a flutter or a focusing reflection, what matters is that the
reflected energy is spread over angle, and $d$ measures exactly that. The
normalised $d_\mathrm{n}$ (Formula (7)) additionally subtracts the edge diffraction
that every finite panel exhibits, so products of different sizes can be
compared fairly.
Swapping them fails in both directions: a diffusion coefficient dropped into a
simulator's scattering slot biases the energy split, and a scattering
coefficient quoted as proof of "diffusion" may describe a surface that merely
redirects the problem reflection somewhere else. Both coefficients are
one-third-octave-band functions that generally rise once the surface relief is
no longer small against the wavelength; a frequency-blind single number
("scatters 90 % of the sound") is neither of them.
## See also
- [Metadiffusers](metadiffusers.md): the deep-subwavelength version of the
Schroeder designs of section 3, slits loaded by Helmholtz resonators that
reach the same reflection phases from a panel a few centimetres thick.
- [In-situ Road-Surface Absorption](../surfaces/road-absorption.md): the other surface
family measured in the field rather than the laboratory, with the ISO 13472
subtraction and spot methods.
- [Sound Absorption Measurement and Rating](../absorbers/absorption-measurement.md): the
same reverberation room used by ISO 17497-1, measuring absorption instead of
scattering.
- [Outdoor Sound Propagation](../../environment/propagation/outdoor-propagation.md): the full ISO 9613-1
atmospheric-absorption model whose pure-tone coefficient the ISO 17497-1
air-attenuation relations consume.
- API reference: [`materials.diffusers.scattering_diffusion`](https://docs.jmrp.io/phonometry/reference/api/materials/scattering-diffusion/) and [`materials.diffusers.design`](https://docs.jmrp.io/phonometry/reference/api/materials/design/).
## References
- Cox, T. J., & D'Antonio, P. (2017). *Acoustic absorbers and diffusers:
Theory, design and application* (3rd ed.). CRC Press.
ISBN 978-1-4987-4099-9.
[doi:10.1201/9781315369211](https://doi.org/10.1201/9781315369211).
The reference monograph on diffuser theory and design, by the authors
behind the ISO 17497-2 diffusion-coefficient method: the
scattering-versus-diffusion distinction, the
measurement rigs and the design guidance this page condenses. Appendix B
(Normalized diffusion coefficient table, pp. 481-485) is the published BEM
anchor for the diffuser-prediction model on this page.
- Hargreaves, T. J., Cox, T. J., Lam, Y. W., & D'Antonio, P. (2000). Surface
diffusion coefficients for room acoustics: Free-field measures of
single-plane diffusion. *The Journal of the Acoustical Society of America*,
108(4), 1710-1720.
[doi:10.1121/1.1310192](https://doi.org/10.1121/1.1310192).
The free-field diffusion-coefficient method behind ISO 17497-2; its Table I
documents the commercial $N = 7$ QRD geometry (0.2 m maximum well depth) used
in the worked example above.
- Audio Engineering Society. (2001). *AES information document for room
acoustics and sound reinforcement systems — Characterization and
measurement of surface scattering uniformity* (AES-4id-2001). *Journal of
the Audio Engineering Society*, 49(3), 149-165.
[AES standards in print](https://www.aes.org/publications/standards/list.cfm).
The single-plane free-field diffusion-coefficient procedure that
ISO 17497-2 later standardised.
- International Organization for Standardization. (2004). *Acoustics —
Sound-scattering properties of surfaces — Part 1: Measurement of the
random-incidence scattering coefficient in a reverberation room*
(ISO 17497-1:2004+A1:2014, the edition implemented here).
[iso.org catalogue](https://www.iso.org/standard/31397.html).
The turntable method implemented in section 1 of this page and the
base-plate limits of the standard's Table 1.
- International Organization for Standardization. (2012). *Acoustics —
Sound-scattering properties of surfaces — Part 2: Measurement of the
directional diffusion coefficient in a free field* (ISO 17497-2:2012).
[iso.org catalogue](https://www.iso.org/standard/55293.html).
The goniometer autocorrelation coefficient behind section 2 of this page,
its area weighting and the normalised $d_\mathrm{n}$.
## Standards
ISO 17497-1:2004+A1:2014 (scattering coefficient), ISO 17497-2:2012 (diffusion
coefficient), and ISO 9613-1:1993, from which only the pure-tone attenuation
coefficient $\alpha$ consumed by the ISO 17497-1 Clause 8 air-attenuation relations
(Eqs. (2)/(3)); the full atmospheric-absorption model is covered in
[Outdoor Sound Propagation](../../environment/propagation/outdoor-propagation.md). Numerical conformance
against the standards' worked examples and closed forms is tracked in
[CONFORMANCE.md](../../CONFORMANCE.md).


