---
title: "Getting Started"
description: "Install phonometry and run your first fractional octave analysis."
---
## Installation
**Option 1: From PyPI (Recommended)**
```bash
pip install phonometry
```
Optional extras:
```bash
pip install phonometry[plot] # matplotlib, for filter response plots
pip install phonometry[perf] # numba, faster 'impulse' time weighting
pip install phonometry[full] # both
```
**Option 2: Cloning and Installing**
```bash
git clone https://github.com/jmrplens/phonometry.git
cd phonometry
pip install .
```
**Option 3: Git Submodule**
```bash
git submodule add https://github.com/jmrplens/phonometry.git
# Then install in editable mode to use it from your project
pip install -e ./phonometry
```
## The processing chain at a glance
Every phonometry analysis is some subset of one pipeline — take the raw
signal, convert it to physical units, weight it in frequency, split it into
standardized bands, smooth it in time and reduce it to metrics:

 Each stage is an independent function or class you can use on its own; the
guides cover them left to right ([Calibration](/phonometry/guides/calibration/) →
[Frequency Weighting](/phonometry/guides/weighting/) → [Filter Banks](/phonometry/guides/filter-banks/) →
[Time Weighting](/phonometry/guides/time-weighting/) → [Levels](/phonometry/guides/levels/)).
## Basic Usage: 1/3 Octave Analysis
Analyze a signal and get the Sound Pressure Level (SPL) per frequency band.
```python
import numpy as np
from phonometry import octavefilter
fs = 48000
t = np.linspace(0, 1, fs, endpoint=False)
# Composite signal: 100Hz + 1000Hz
signal = np.sin(2 * np.pi * 100 * t) + np.sin(2 * np.pi * 1000 * t)
# Apply 1/3 octave filter bank
spl, freq = octavefilter(signal, fs=fs, fraction=3)
print(f"Bands: {freq}")
print(f"SPL [dB]: {spl}")
```
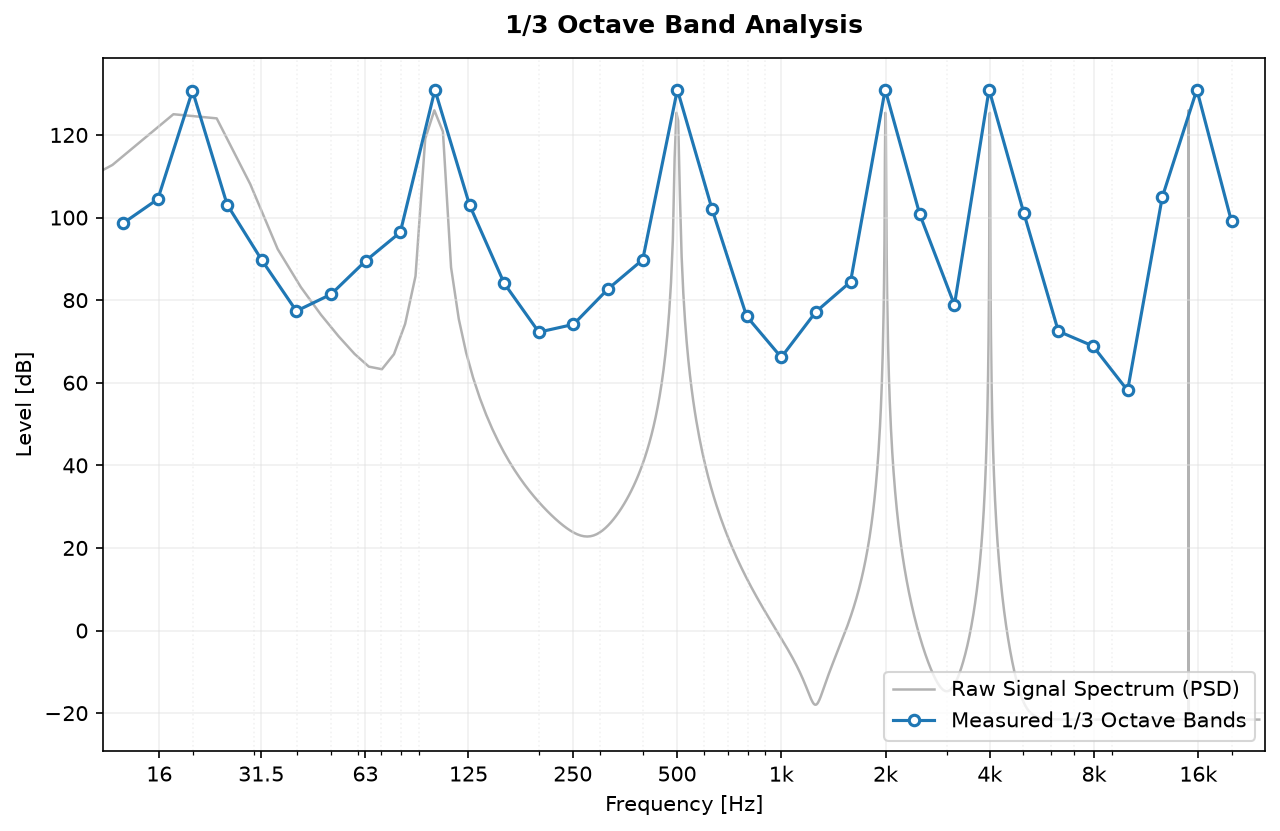
 *Example of a 1/3 Octave Band spectrum analysis of a complex signal.*
## Analyzing an audio file
```python
from scipy.io import wavfile
from phonometry import octavefilter
# Load standard WAV file
fs, signal = wavfile.read("measurement.wav")
# Analyze
# Note: To obtain real-world SPL values, you must calibrate the input.
# See the Calibration guide.
spl, freq = octavefilter(signal, fs=fs, fraction=3)
```
Integer audio (e.g. int16 WAV data) is converted to float64 internally, so it is
safe to pass `wavfile.read` output directly.
## Where to go next
- [Filter Banks](/phonometry/guides/filter-banks/) — choose an architecture and inspect responses
- [Calibration and dBFS](/phonometry/guides/calibration/) — get real-world SPL values
- [API Reference](/phonometry/reference/api/) — every parameter of every function